TL;DR
An A/B test splits visitors at random between two versions of a page and compares them on one metric chosen before launch. On paid traffic, your budget sets the smallest lift you can detect: a 10% lift takes about 1,500 conversions per variant, a 30% lift about 170. So test big swings like the offer and the angle, one ad at a time, and check significance with a calculator.
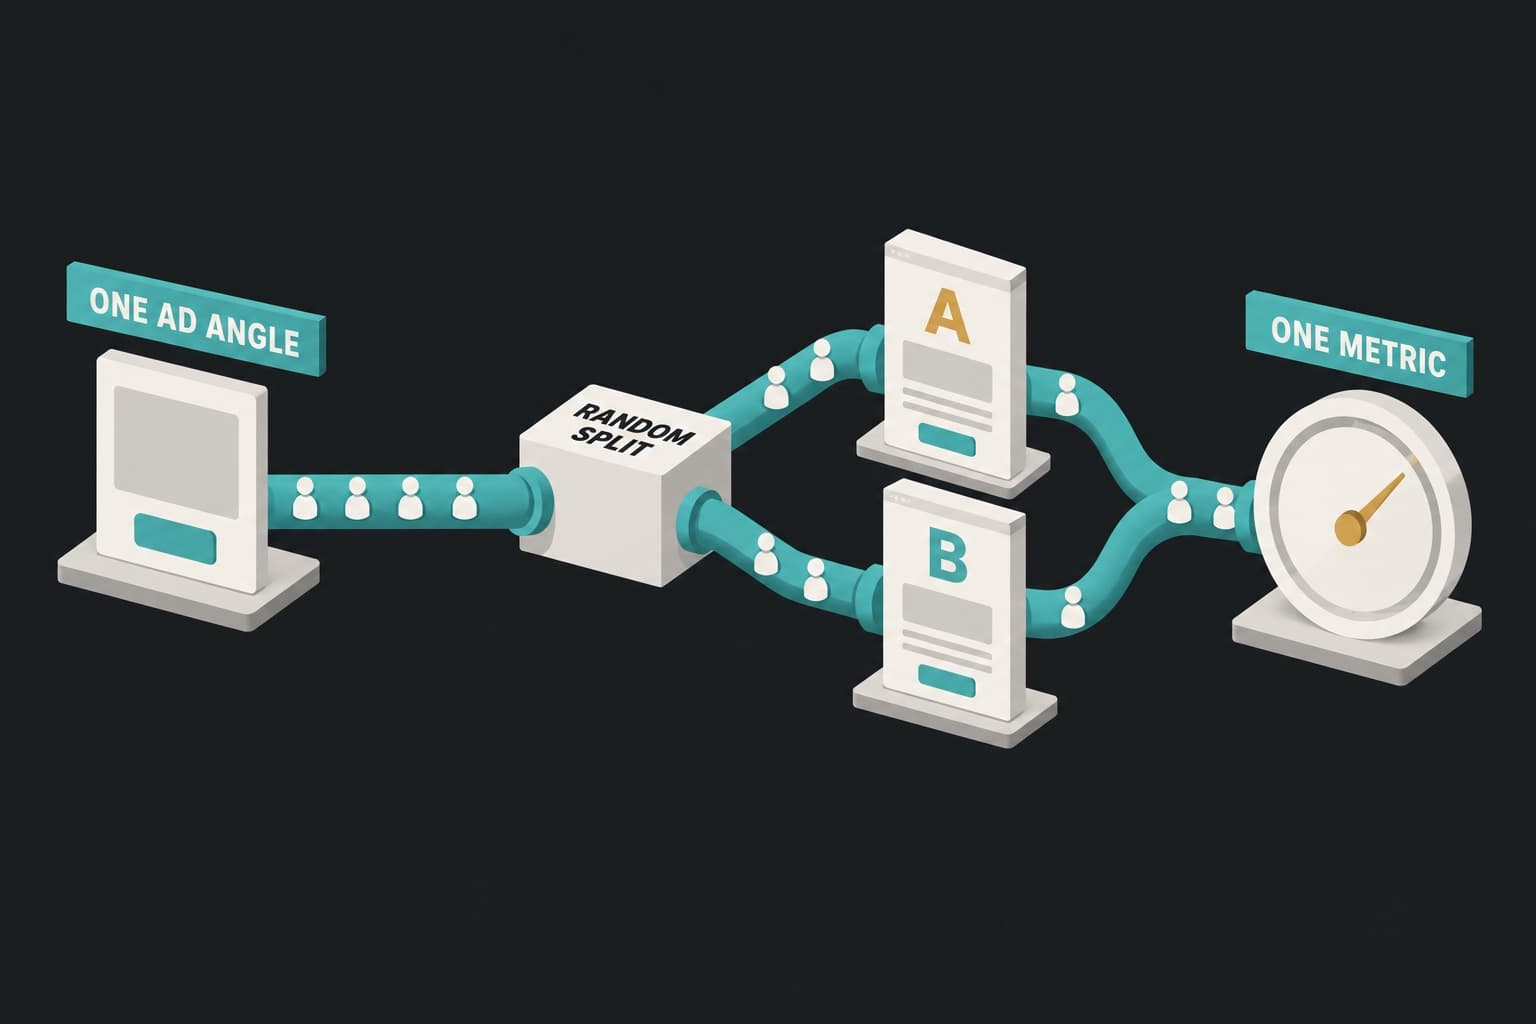
An A/B test sends each visitor at random to one of two versions of a page, then keeps whichever wins on a metric you picked before launch.
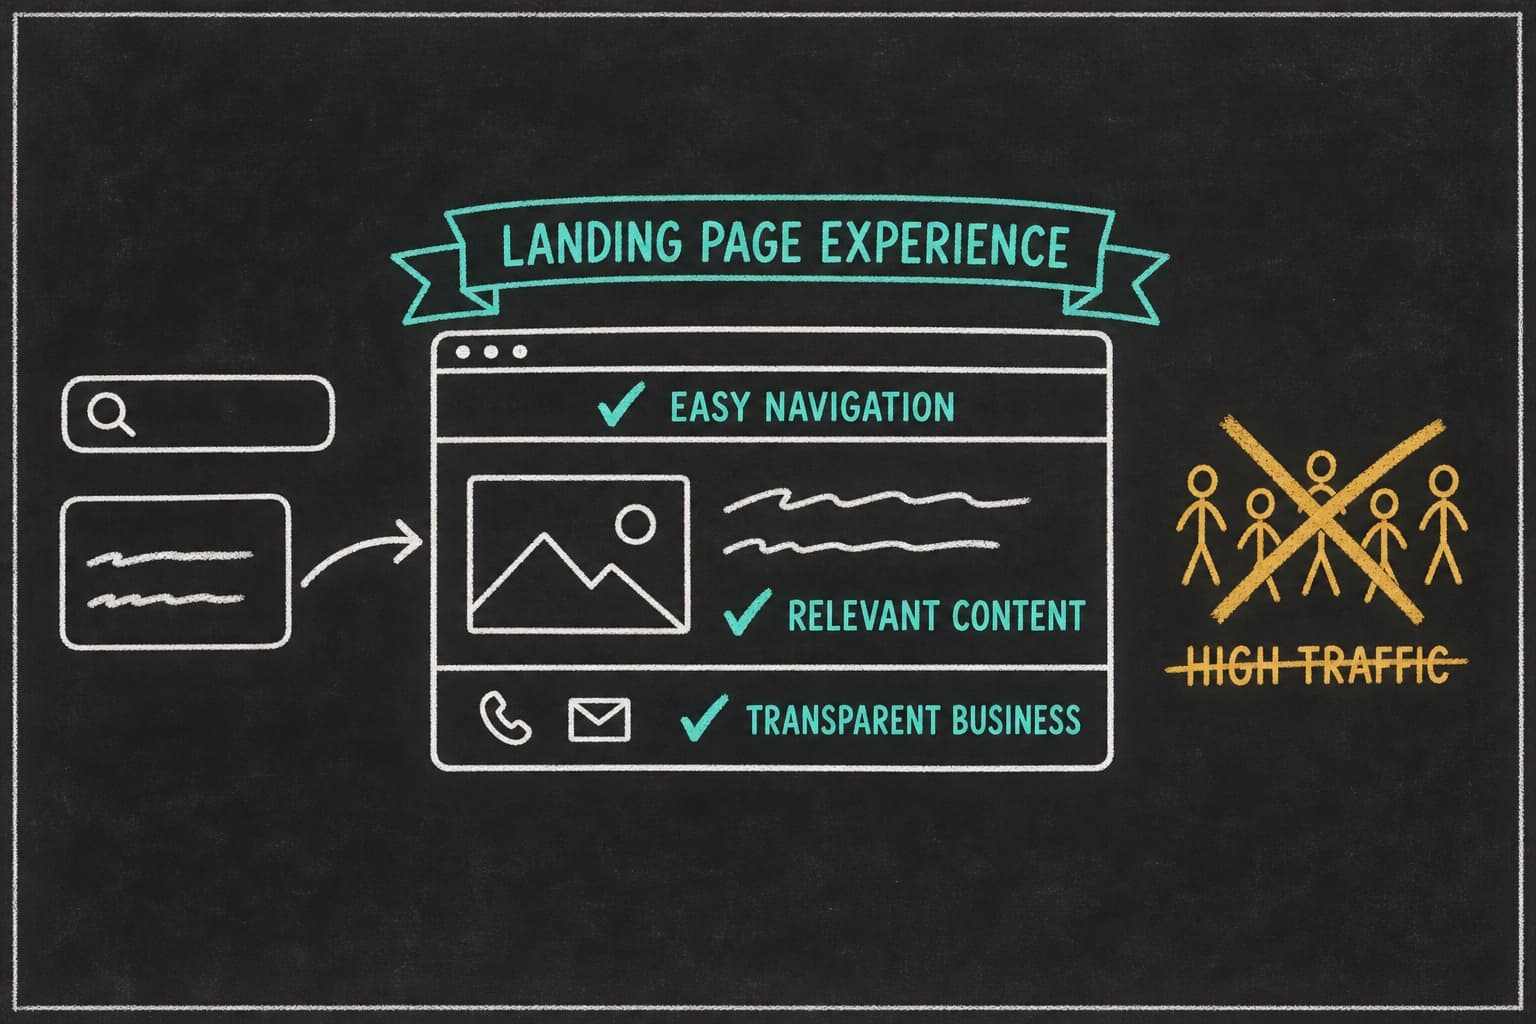
Here’s what most A/B testing guides miss: they assume the traffic is free. Yours isn’t. Every visitor in a landing page test is a click you paid for, so the budget, not the calendar, decides what the test can learn. At a 3% conversion rate, a page getting 2,000 paid clicks a week would need about four years to detect a 5% lift.
You know testing beats guessing. This guide covers how to A/B test landing pages when every visitor costs money. It covers the ad-page unit, a seven-step process, sample size as ad spend, what to test first, and the mistakes behind confident wrong answers.
Key Takeaways
- A 10% lift takes roughly 1,500 conversions per variant to detect; a 30% lift takes about 170. The ad budget limits what a test can find.
- Run one test per ad angle, and split after the click so the ad, the audience, and the bid stay constant.
- Judge each test on the metric that pays: revenue per visitor for ecommerce, demo or trial rate for SaaS, qualified leads per visitor for lead gen and services.
- Most tests lose. At Microsoft, only about one-third of experiments improved their target metric, so volume and big swings beat clever micro-tests.
What is an A/B test?
An A/B test, also called a split test, is a controlled experiment that shows two versions of a page, email, or ad to randomly assigned visitors at the same time, then compares them on one metric chosen before launch. The random split lets you credit the difference to the change, not the traffic.
How an A/B test works: control, variant, random split, one metric
- Control and variant. The control (A) is the current page. The variant (B) is the challenger, built around one idea.
- Random assignment. Each visitor gets A or B by chance and keeps it on return visits, so everything else evens out across both.
- Same time. Both run in the same weeks. A before-and-after comparison isn’t an A/B test.
- One metric, decided before launch. That number picks the winner. Everything else is diagnosis.
Every Pagedeck page ships with the split built in, server-side, with no script to bolt on. See how ad-matched pages and built-in testing work.
A/B testing vs split testing vs multivariate testing
What is split testing? In most tools, it’s the same thing as A/B testing. Some reserve “split test” for split-URL tests, where each version lives at its own URL. Multivariate testing tests every combination of several changes.
| Test type | What changes | Traffic needed | When to use it |
|---|---|---|---|
| A/B test | Two versions, same URL | Moderate: two groups | Most landing page questions |
| Split-URL test | Two pages, different URLs | Moderate: two groups | Redesigns and new page structures |
| Multivariate test | Several elements, every combination | High: one group per combination | High-traffic pages, late in a program |
| A/A test | Nothing: two identical versions | Moderate: two groups | Checking the setup |
On paid traffic, multivariate testing rarely makes sense. Three headlines and two hero images make six combinations, each needing its own sample.
What an A/A test is and why to run one first
An A/A test splits traffic between two identical versions. If the results show a meaningful gap, the split, the tracking, or the conversion counting is broken. Kohavi and colleagues recommend them in their practical guide to controlled experiments.
Check the split, too. In a 50/50 test with 10,000 visitors, each side should land within about 100 of 5,000. A 5,200 to 4,800 split is four standard deviations off. That’s a sample ratio mismatch: a bug, not chance.
Why A/B testing landing pages is different when you pay for the traffic
Paid visitors arrive with the exact expectation your ad set, so the ad is part of the test.
The ad is part of the test: one test per ad angle
When several ads with different promises feed one test, the result blends how each variant fits each promise. The blend can hide a real winner.
Take a hypothetical account run by a media buyer named Dana, selling a meal kit. One ad leads with 50% off the first box, another with dinner in 15 minutes, and both feed one page.
Dana tests a speed headline. It wins with the speed ad’s visitors and loses with the discount ad’s, which sends most of the traffic, so the blend reads flat. She calls it a loser. For a third of her traffic, it was a winner.
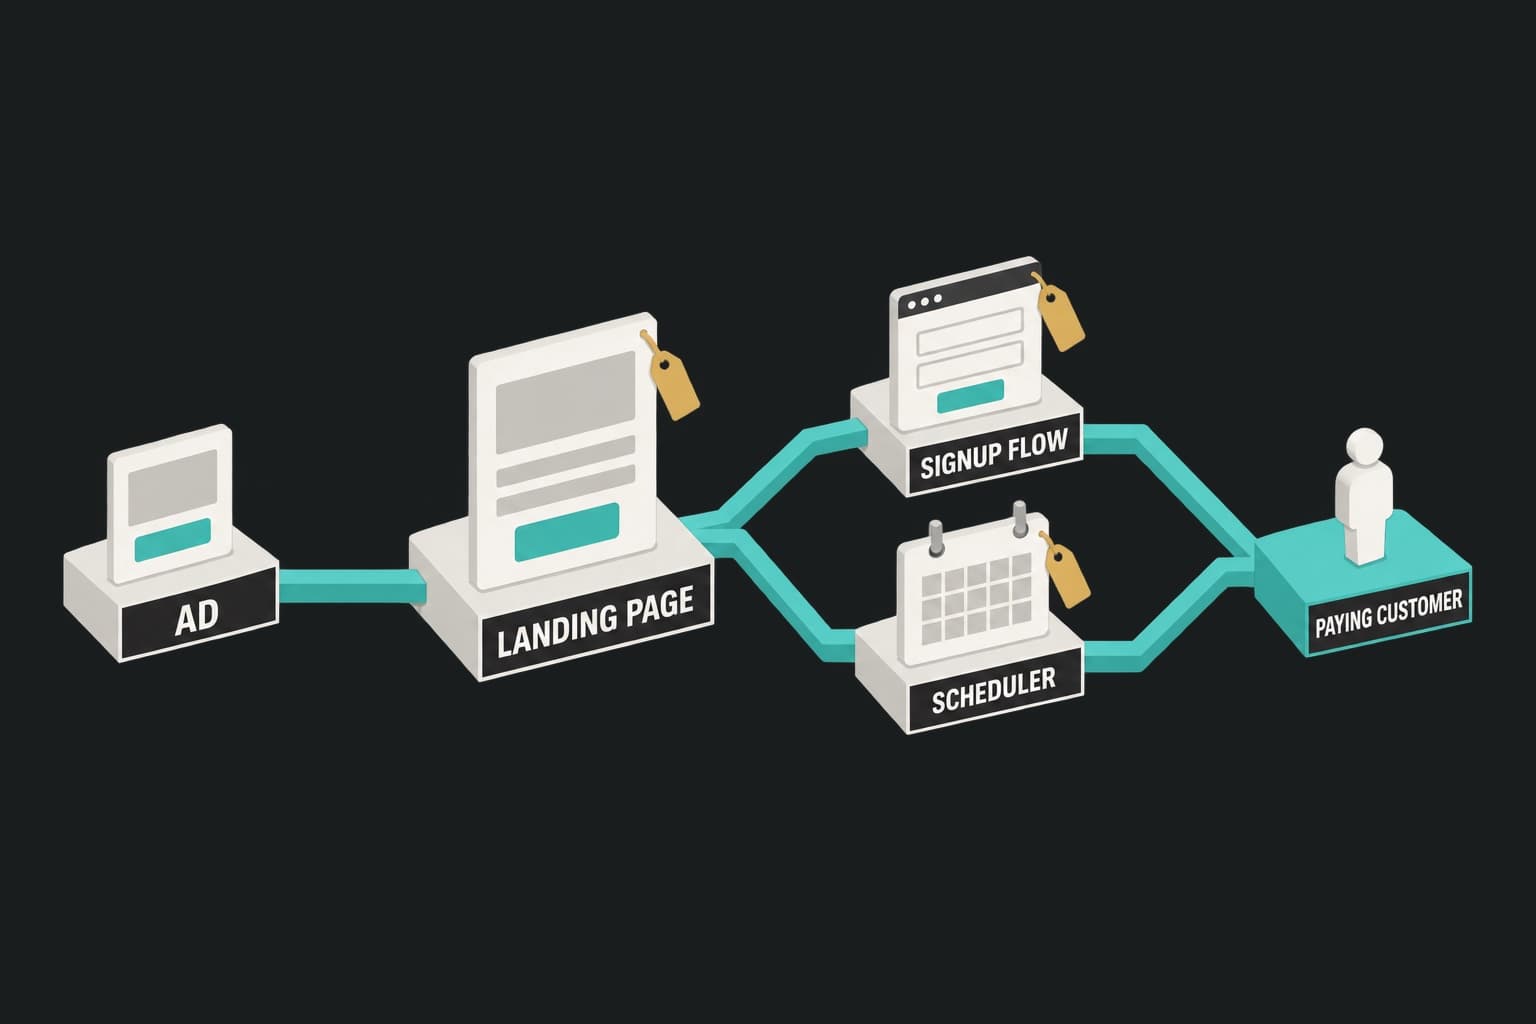
The fix: one page per ad angle, one test per page. HexClad, which has put “millions of dollars through Pagedeck,” duplicates a working format and swaps copy and media to match each ad. That’s the logic behind ad-matched landing pages: each ad gets a page that continues its pitch, and each page carries its own test.
Landing page A/B tests vs Meta and Google Ads experiments
Google Ads custom experiments split traffic at the campaign level, by cookie or by search. Meta’s A/B test tool splits the audience into random, non-overlapping groups, each seeing a version that differs in one variable.
That’s right for ad questions. For a page question, changing the page inside an ad-platform experiment can change delivery too. On Google search campaigns, landing page experience is one of the signals behind Ad Rank, so the two arms can win different auctions at different prices. On a conversion-optimized Meta campaign, delivery learns from your conversion event, so a page that converts differently can pull a different audience.
A split after the click holds the ad, the audience, and the bid constant.
Server-side vs client-side testing, and why flicker matters on paid clicks
Client-side tools swap content in the browser after the page starts rendering. Either the visitor sees the original flash before the variant, or an anti-flicker snippet hides the page until the swap finishes. The flash can bias the test; the blank page is dead time on a click you paid for.
Server-side testing assigns the variant before the page is sent. Each visitor gets one complete version, and there’s no testing script on the page. On Google search campaigns, a slow or jumpy page also works against landing page experience and Quality Score.
How to A/B test a landing page, step by step
In landing page A/B testing, steps 2 and 4 decide whether a test can return an answer, before a single visitor arrives.
1. Pick the landing page to split test and the ad angle feeding it
Start with the page that gets the most paid traffic from a single ad angle. Volume sets how fast you get an answer, and one angle keeps the result readable. If that traffic lands on a homepage or product page, fix that first: here’s why paid traffic belongs on a dedicated landing page.
2. Choose the metric that pays
Conversion rate is the default, and it’s often wrong. A discount can raise conversion rate and lower revenue per visitor. A lead gen test can raise form fills and lower lead quality.
| Business model | Primary test metric | Guardrail to watch |
|---|---|---|
| Ecommerce | Revenue or margin per visitor | Average order value, discount depth |
| B2B SaaS | Demo request or trial start rate | Demo show rate or activation, tracked downstream |
| Lead gen and services | Qualified leads per visitor | Raw capture rate |
In a 50/50 split, both variants cost the same per visitor, so cost per purchase just mirrors conversion rate; revenue per visitor catches the offer that sells more for less. For SaaS and lead gen, pass the variant name into your CRM through a hidden form field and judge qualification there. See which conversion to measure at each funnel stage.
3. Write a hypothesis tied to the ad’s promise
Name the change, the reason, and the expected effect. “Test a new headline” isn’t a hypothesis. “Visitors from the cut-reporting-time ad don’t book demos because the headline leads with integrations; repeating the time-saving promise will raise demo requests at least 25%” is one. Write down the smallest lift worth shipping.
4. Set the sample size and duration before launch
Decide how many conversions each variant needs, and don’t call the result before then. Plug your baseline conversion rate and the smallest lift worth detecting into Evan Miller’s free sample size calculator, divide total visitors by weekly paid clicks, and round up to whole weeks.
5. Change one thing
One idea, not one element. A new offer might touch the headline, price block, and CTA, and that’s still one hypothesis. Two ideas at once, like a new offer and a new hero image, break the test. Pagedeck’s AI variant generation writes copy along distinct marketing angles while the layout stays identical, so the test measures the message.
6. Run full weeks and hold the ad account still
Run in whole weeks so every weekday counts equally, with two weeks as a floor. Keep budgets, bids, targeting, and creative constant on the ads feeding the page. A mid-test budget increase changes who arrives; the split stays fair, but the result may not hold for either audience. On Meta, a significant edit can also reset learning.
7. Read the result with a calculator, check by ad and device, ship it, log it
When the planned sample is in, enter each variant’s visitors and conversions into a significance calculator such as Evan Miller’s chi-squared test. Check the split for sample ratio mismatch, and read the ad and device breakdowns as leads for the next test, not proof. Ship the winner or keep the control. Log the hypothesis, numbers, and decision: the log turns one-off tests into a program.
Want the test to live on the page, not in the ad account? Build your first page free, no credit card needed.
How long to run an A/B test, and how much traffic you need
At least two full weeks, and until you reach the sample set before launch. On paid traffic, that sample is a budget.
A/B test sample size: the conversions-per-variant rule
Kohavi and colleagues’ guide to controlled experiments gives a rule for 95% confidence and 80% power. Visitors per variant ≈ 16 × p(1 - p) ÷ Δ², where p is the baseline conversion rate (conversions per visitor) and Δ the absolute change to detect. Rewritten in conversions:
Conversions per variant ≈ 16 × (1 - p) ÷ m², where m is the relative lift you want to detect.
At a 3% baseline, a 10% lift needs about 1,550 conversions per variant, a 20% lift about 390, a 30% lift about 170, and a 50% lift about 60. The number barely moves with conversion rate (at 10%, a 10% lift still takes about 1,440), but halve the lift and you need four times the conversions. Use it as a ten-second check, then get the real number from the calculator.
Turning sample size into ad spend
At a 3% baseline and an assumed $1.50 CPC (swap in your own). It assumes every click loads the page, so real spend runs higher.
| Lift to detect | Visitors per variant | Conversions per variant | Total visitors | Spend at $1.50 CPC |
|---|---|---|---|---|
| 10% | 51,733 | ~1,550 | 103,467 | ~$155,000 |
| 20% | 12,933 | ~390 | 25,867 | ~$38,800 |
| 30% | 5,748 | ~170 | 11,496 | ~$17,200 |
A test adds no media cost if you’d buy the traffic anyway. The real costs are time and the conversions the losing variant gives up while it runs. The point is the relationship: your budget sets the smallest lift you can detect. At these assumptions, $5,000 a month in clicks buys enough traffic to detect a 30% lift in about three and a half months, and a 10% lift in about 2.6 years.
Consider how a growth marketer at a hypothetical B2B software company, call her Priya, might use this. Her demo page gets 1,500 paid clicks a week and converts at 4%. Testing CTA button copy, best case a 10% lift, needs about 1,540 demo requests per variant: 76,800 visitors across both, 51 weeks of traffic.
A new angle that could move demo requests 30% needs about 170 per variant, 8,533 visitors in total, and six weeks. Priya tests the angle. The numbers are illustrative; the ratio isn’t.
Landing page testing without the volume: one page per ad angle
If a page can’t reach its sample in about six weeks, ship one page per ad angle and compare them on cost per purchase or cost per qualified lead, ad set by ad set. Label it directional, not a controlled test: each page gets a different ad and audience.
What to A/B test on a landing page, in order of impact
Rank ideas by how much they could move the metric, because on paid traffic only big moves are detectable.
The offer
The offer decides who converts and what they’re worth: 20% off vs a free gift, a trial vs a demo, a quote vs a consultation. Judge offer tests on revenue per visitor or qualified leads, never conversion rate alone. For an ecommerce example, see testing BOGO against your other offers.
The headline and angle, matched to the ad
The headline carries the ad’s promise onto the page. Repeating the ad’s angle vs not is usually the second-best test available, and one of the conversion elements worth testing.
Proof: what kind and where it sits
Test the type of proof (a customer count vs a named case study) and its position (beside the CTA vs lower on the page).
Page length and section order
A cold visitor from a prospecting ad needs more explaining than a warm one from retargeting. Test long against short, or move proof above the offer, starting from section order by traffic temperature.
Price presentation and risk reversal
Same price, framed differently: per day vs per month, savings in dollars vs percent, a guarantee beside the price vs in the footer. Cheaper to build than a new offer, usually a smaller move.
The CTA and the form, last
Button copy, color, field count, multi-step forms: among the most tested elements online, and among the least likely to produce a lift paid traffic can detect. Testing a lead gen page follows the same order: offer, headline, then form.
What not to test on paid traffic: changes too small to detect
If the rule of thumb says a test needs a year of traffic, it isn’t a test. It’s a wait. That covers most color tweaks and minor copy edits. Get visual hierarchy and CTA contrast right once, as design decisions rather than experiments.
A/B testing examples across business models
Search ads: the Bing headline test
At Bing, a suggested change to how ad headlines were displayed sat untested for more than six months as low priority. When an engineer ran it, revenue rose 12%, which Bing estimated at more than $100 million a year in the US alone, according to Kohavi and Thomke in Harvard Business Review.
Nobody reliably predicts which ideas will win. And Bing can detect lifts far smaller than 12%; most advertisers can’t.
B2B SaaS: matching the search keyword’s verb
ConversionLab ran a test on Campaign Monitor’s paid search traffic, published by Unbounce. Searchers used different verbs (design, create, build) for the same email tool, and the variant matched the headline and CTA verb to the visitor’s search. The published result was a 31.4% lift in conversions.
The lesson transfers to any search campaign: repeat the searcher’s words back. More in how SaaS landing pages convert paid traffic.
How to read a published test
The case study reports 1,274 visitors over 77 days, more than 100 conversions per variant, and “100% statistical significance.” Three checks apply to any published result.
- Sample size. With about 100 conversions per variant, the rule of thumb puts the smallest reliably detectable lift near 35% to 40%. A 31.4% result can be real, but small tests that reach significance tend to overstate the effect.
- Significance. No test reaches 100%; some chance of noise always remains. Read it as shorthand for high confidence.
- Duration. 77 days is exactly 11 full weeks, so every weekday is equally represented, a point in the test’s favor.
Trust the direction and the lesson, and expect your own version to show a smaller lift.
Ecommerce: iteration volume at Fulton and Gravel
Most tests lose. At Microsoft, only about one-third of experiments designed to improve a key metric succeeded, according to Kohavi, Crook, and Longbotham.
That’s why the strongest ecommerce results come from programs. Fulton moved 100% of its paid traffic to Pagedeck pages and ran 50+ iterations on one core page. The brand reports a 110% lift in paid conversion rate over its previous landing pages (how Fulton increased paid conversion rate by 110%). Gravel cut cost per conversion by 66% on one campaign and cost per purchase by 37% on another.
These are the brands’ results, not a promise, and neither is a single A/B test. The mechanism transfers: when most tests lose, the account that runs more finds more winners.
Illustrative tests for services and lead gen: quote vs consultation
No published result here, just a worked setup. A hypothetical roofing company tests “Get an instant quote” against “Book a free inspection.” The quote asks less, so it may win on form fills; the inspection might win on qualified leads. So the test is judged on qualified leads per visitor: the variant name goes into the CRM through a hidden field, sales marks each lead, and the winner gets decided weeks later.
Common A/B testing mistakes
Peeking and stopping early. Stopping at the first significant reading inflates false positives. In Evan Miller’s worked example, continuous checking pushed the false positive rate from a nominal 5% to 26.1%.
Take a hypothetical HVAC company where the marketing lead, call him Theo, checks his test every morning. On day four, on roughly equal traffic, the variant shows 30 booked calls against the control’s 21. Up 43%. He ships it.
Over the next month, the new page books calls at the old rate. A gap that size on 51 bookings sits well within chance. His plan had called for about 170 per variant.
Changing budgets or targeting mid-test. The result describes two audiences. Hold the account still or restart.
Mixing traffic from different ads. Different promises produce different winners.
Skipping the A/A check or ignoring sample ratio mismatch. A broken split makes any lift meaningless.
Calling a conversion-rate winner that loses revenue. Lift conversion rate 10% with a discount that cuts average order value 15%, and revenue per visitor falls 6.5% (1.10 × 0.85 = 0.935).
Believing big lifts from small samples. A 60% lift on 40 conversions is a hypothesis, not a result.
Leaving test variants indexable. If you test a page that ranks organically, follow Google’s guidance on website testing: no cloaking, rel="canonical" on variants, 302 redirects rather than 301s, and end the test promptly.
Running landing page A/B tests in Pagedeck
Every Pagedeck page ships with server-side A/B testing built in: no flicker, no testing script on the page. First-party analytics show how each variant is performing in real time, and AI variant generation keeps the layout identical so each test measures the message.
You decide what counts as a conversion. Pagedeck can count any event you define, configured through the tracking pixel: a form submit, a booked demo, a signup. On Shopify, completed checkouts are attributed back to the exact page and variant.
UTMs from the ad pass through automatically, and tracking tags added in Pagedeck fire on every page built in it. If the conversion happens on a destination Pagedeck didn’t build, like a signup app or booking tool, put the same tags there. Lead qualification and trial-to-paid stay in your CRM or product analytics.
Testing is unmetered by traffic, so a busy test never gets paused for a quota. Concurrent active tests depend on the plan: 1 on Single brand ($149/mo), 10 on Multi-brand ($299/mo), unlimited on For agencies ($499/mo). The $49 Research only plan has no page building. See pricing, with unmetered pages and traffic on every plan.
Significance is your call: take each variant’s numbers to a calculator.
Frequently asked questions
What is A/B testing used for? Deciding whether a change to a page caused a difference in one metric. It answers “which performs better,” not “why.”
Is A/B testing the same as split testing? Usually, yes. Some tools reserve “split test” for split-URL tests, where each version has its own URL.
How long should you run an A/B test? Until each variant reaches the sample you set before launch, and at least two full weeks. A 20% lift takes about 390 conversions per variant.
What is an A/A test vs an A/B test? An A/A test compares two identical versions to check the split, tracking, and conversion counting before real A/B tests run.
Can you A/B test with low traffic? Only for big changes. With a few dozen conversions a week, a test can detect a lift of 50% or more in reasonable time. Below that, compare one page per ad angle on cost per purchase or cost per qualified lead, as a directional read.
What is the best A/B testing tool? The one that tests where your traffic lands without slowing the page. See A/B testing and CRO tools compared.
Conclusion
Most tests lose: at Microsoft, about two in three failed to improve their target metric. Cleverness doesn’t beat those odds. Volume does: run each A/B test on a big swing, one ad angle at a time, judged on the metric that pays, with the result checked in a calculator.
On paid traffic, a test is a purchase. You’re buying an answer with clicks, so buy answers to questions big enough to show up, then run more of them.
Build your first page free, no credit card needed. Point Pagedeck at an ad, and it builds the matching page with server-side A/B testing built in.